


Kubernetes’ automation and scaling features have made large-scale deployments much more common among organizations of all sizes. This growth in the scale of Kubernetes environments has resulted in a vast attack surface in a technology that can be challenging to secure. At Datadog, for example, we manage tens of thousands of Kubernetes nodes and hundreds of thousands of pods. At such a scale, identifying and understanding interdependencies in the system—particularly the gaps left open by seemingly innocent configuration changes—is beyond manual human capability.
As such, the current mental model of defense for Kubernetes assets is based on lists of known vulnerabilities, so that defenders can identify vulnerable configurations in single resources. But even when an unsecure configuration is identified in a cluster, understanding the real impact is almost impossible because of the complexity and interconnectedness of the components.
This state of affairs embodies a well-known adage from cybersecurity veteran John Lambert: "Defenders think in lists, attackers think in graphs; as long as this is true, attackers win."
Today, we are happy to announce the release of a new open source project: KubeHound, a toolkit for visualizing attack paths in Kubernetes deployments. The aim of the KubeHound project is to shift the mental model of Kubernetes security from list-based thinking to graph-based thinking and help defenders to regain the advantage.
To get started:
- Head over to the GitHub repository
- Read the KubeHound documentation at kubehound.io
Sniffing out attack paths in Kubernetes
KubeHound provides a graph database of attack paths in a Kubernetes cluster and maps these to existing vulnerabilities in your environment. You can then use a graph client like G.V() to create graph visualizations of the most critical attack paths in your cluster.
The visualizations you can generate with KubeHound help you answer several key questions, including:
- What is the shortest exploitable path between an internet facing service and a critical asset?
- What percentage of internet-facing services have an exploitable path to a critical asset?
- What type of control would cut off the largest number of attack paths to a critical asset in your clusters?
By what percentage did the introduction of a security control reduce the attack surface in your environment?
In addition to uncovering security misconfigurations within a cluster, KubeHound also helps you understand the impact and severity of each finding, so you can prioritize security controls to defend against the most serious threats. By putting findings in perspective with a global view of dependencies, teams can quantitatively assess risk, evaluate impact, and prioritize remediations.
Batteries (of attacks) included
KubeHound has been developed on top of existing research into Kubernetes security. Most of the known attacks against Kubernetes, from container breakout to lateral movement, have been listed, documented, and implemented in the tool. In our Attack Reference page, we provide detailed documentation explaining when and how each attack can be performed, along with the YAML of a sample vulnerable resource.
For instance, let's look at CE_NSENTER (the "CE" stands for "container escape"). The prerequisites section shows that an attacker can perform the attack if the pod runs as privileged and shares the host PID namespace. It also shows a full, deployable example of a vulnerable resource:
apiVersion: v1
kind: Pod
metadata:
  name: nsenter-pod
  labels:
    app: kubehound-edge-test
spec:
  hostPID: true
  containers:
    - name: nsenter-pod
      image: ubuntu
      securityContext:
        privileged: true
      command: [ "/bin/sh", "-c", "--" ]
      args: [ "while true; do sleep 30; done;" ]
Then, it describes how to identify vulnerable containers and details step by step how an attacker can perform the attack.
Red and blue team use cases
KubeHound collects all required information directly from the API server of your Kubernetes cluster, computes attack paths, and stores the result into a graph database, JanusGraph.
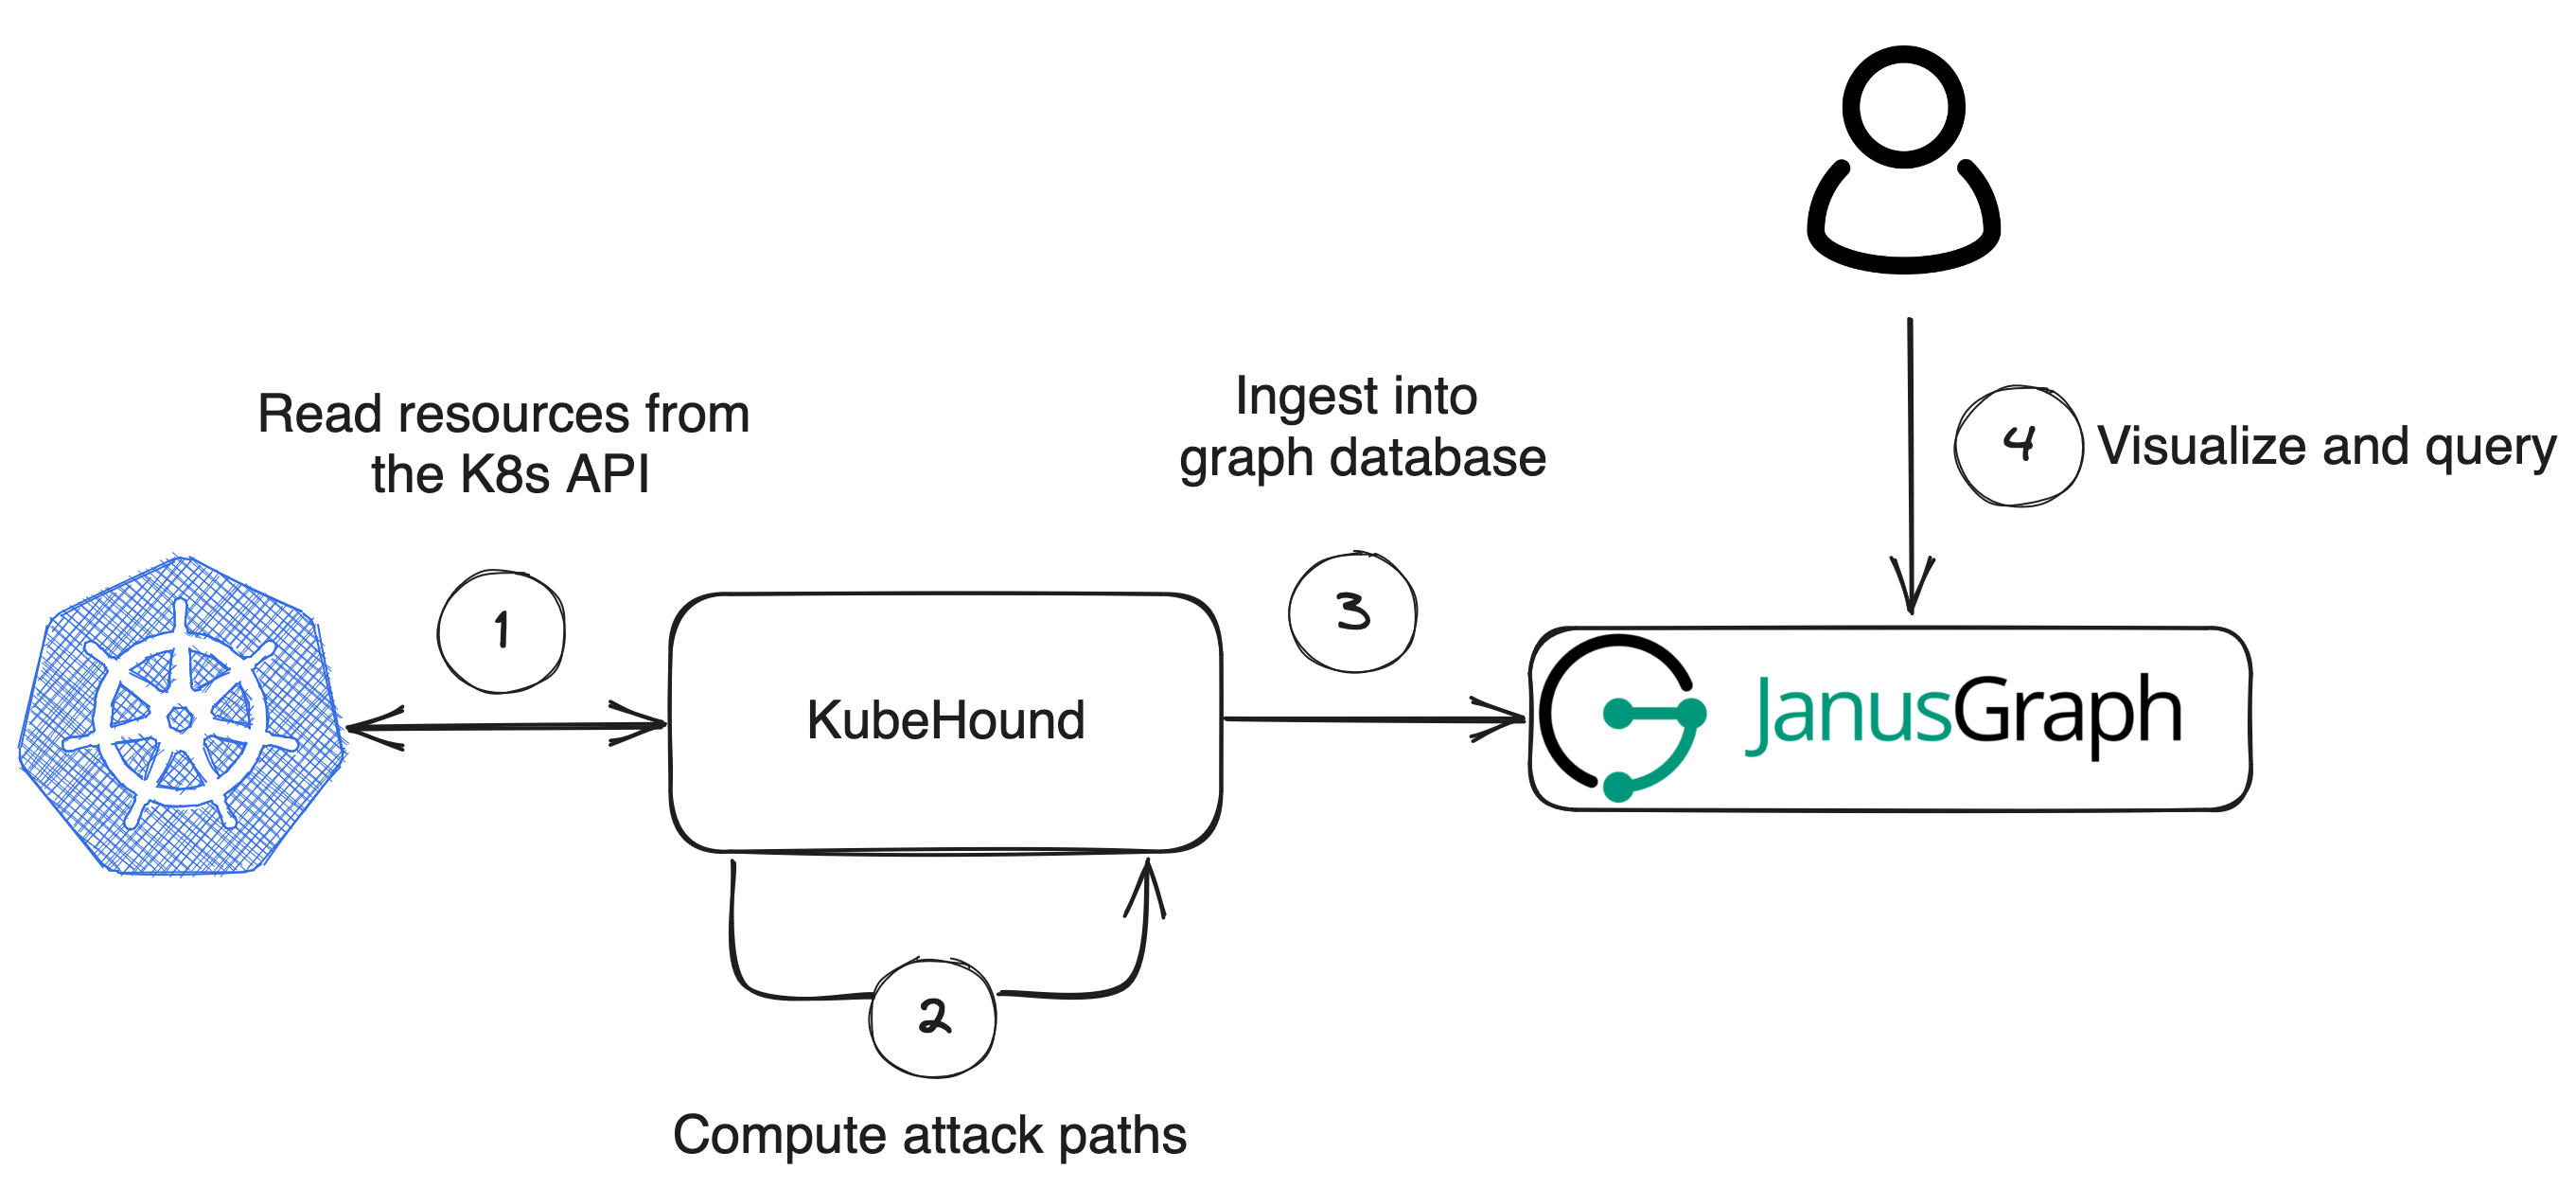
After that, you can use a JanusGraph GUI client like G.V() to visualize and query attack paths in your cluster.
Before jumping into real-life examples, let’s define a couple key terms we are going to be using:
- Endpoint: A KubeHound graph model abstraction that represents an IP:Port exposed at some level by the cluster; Kubernetes services are a subset of these.
- Critical asset: An entity in KubeHound that, if compromised, would result in cluster-admin access, or an equivalent level. For now, this designation is limited to Kubernetes roles that allow an attacker to compromise the whole cluster, such as the cluster-admin ClusterRole, but we may expand this to other entities in the future—e.g., specific nodes, containers, etc.
Red team: Looking for low-hanging fruit
JanusGraph is an open source, scalable graph database that can be queried using the Gremlin query language, a functional dialect of Groovy. But let’s be honest: Gremlin is complex, and the learning curve can feel intimidating. To make your life easier, we created a KubeHound Domain-Specific Language (DSL)—a simple overlay on the Gremlin query language that covers most of the basic use cases.
Let’s analyze a fictional small Kubernetes cluster. We can start by getting a feel of the cluster's scale:
kh.containers().count()
⇒ 1982

kh.pods().count()
⇒ 827

kh.nodes().count()
⇒ 85
A cluster like this, although not huge, has a number of different attack paths that would be challenging to process manually.
First, let's identify the critical paths—attack paths that allow an attacker to gain full privileges on the cluster (e.g., by gaining the cluster-admin ClusterRole).
kh.containers().criticalPaths().count()
⇒ 66984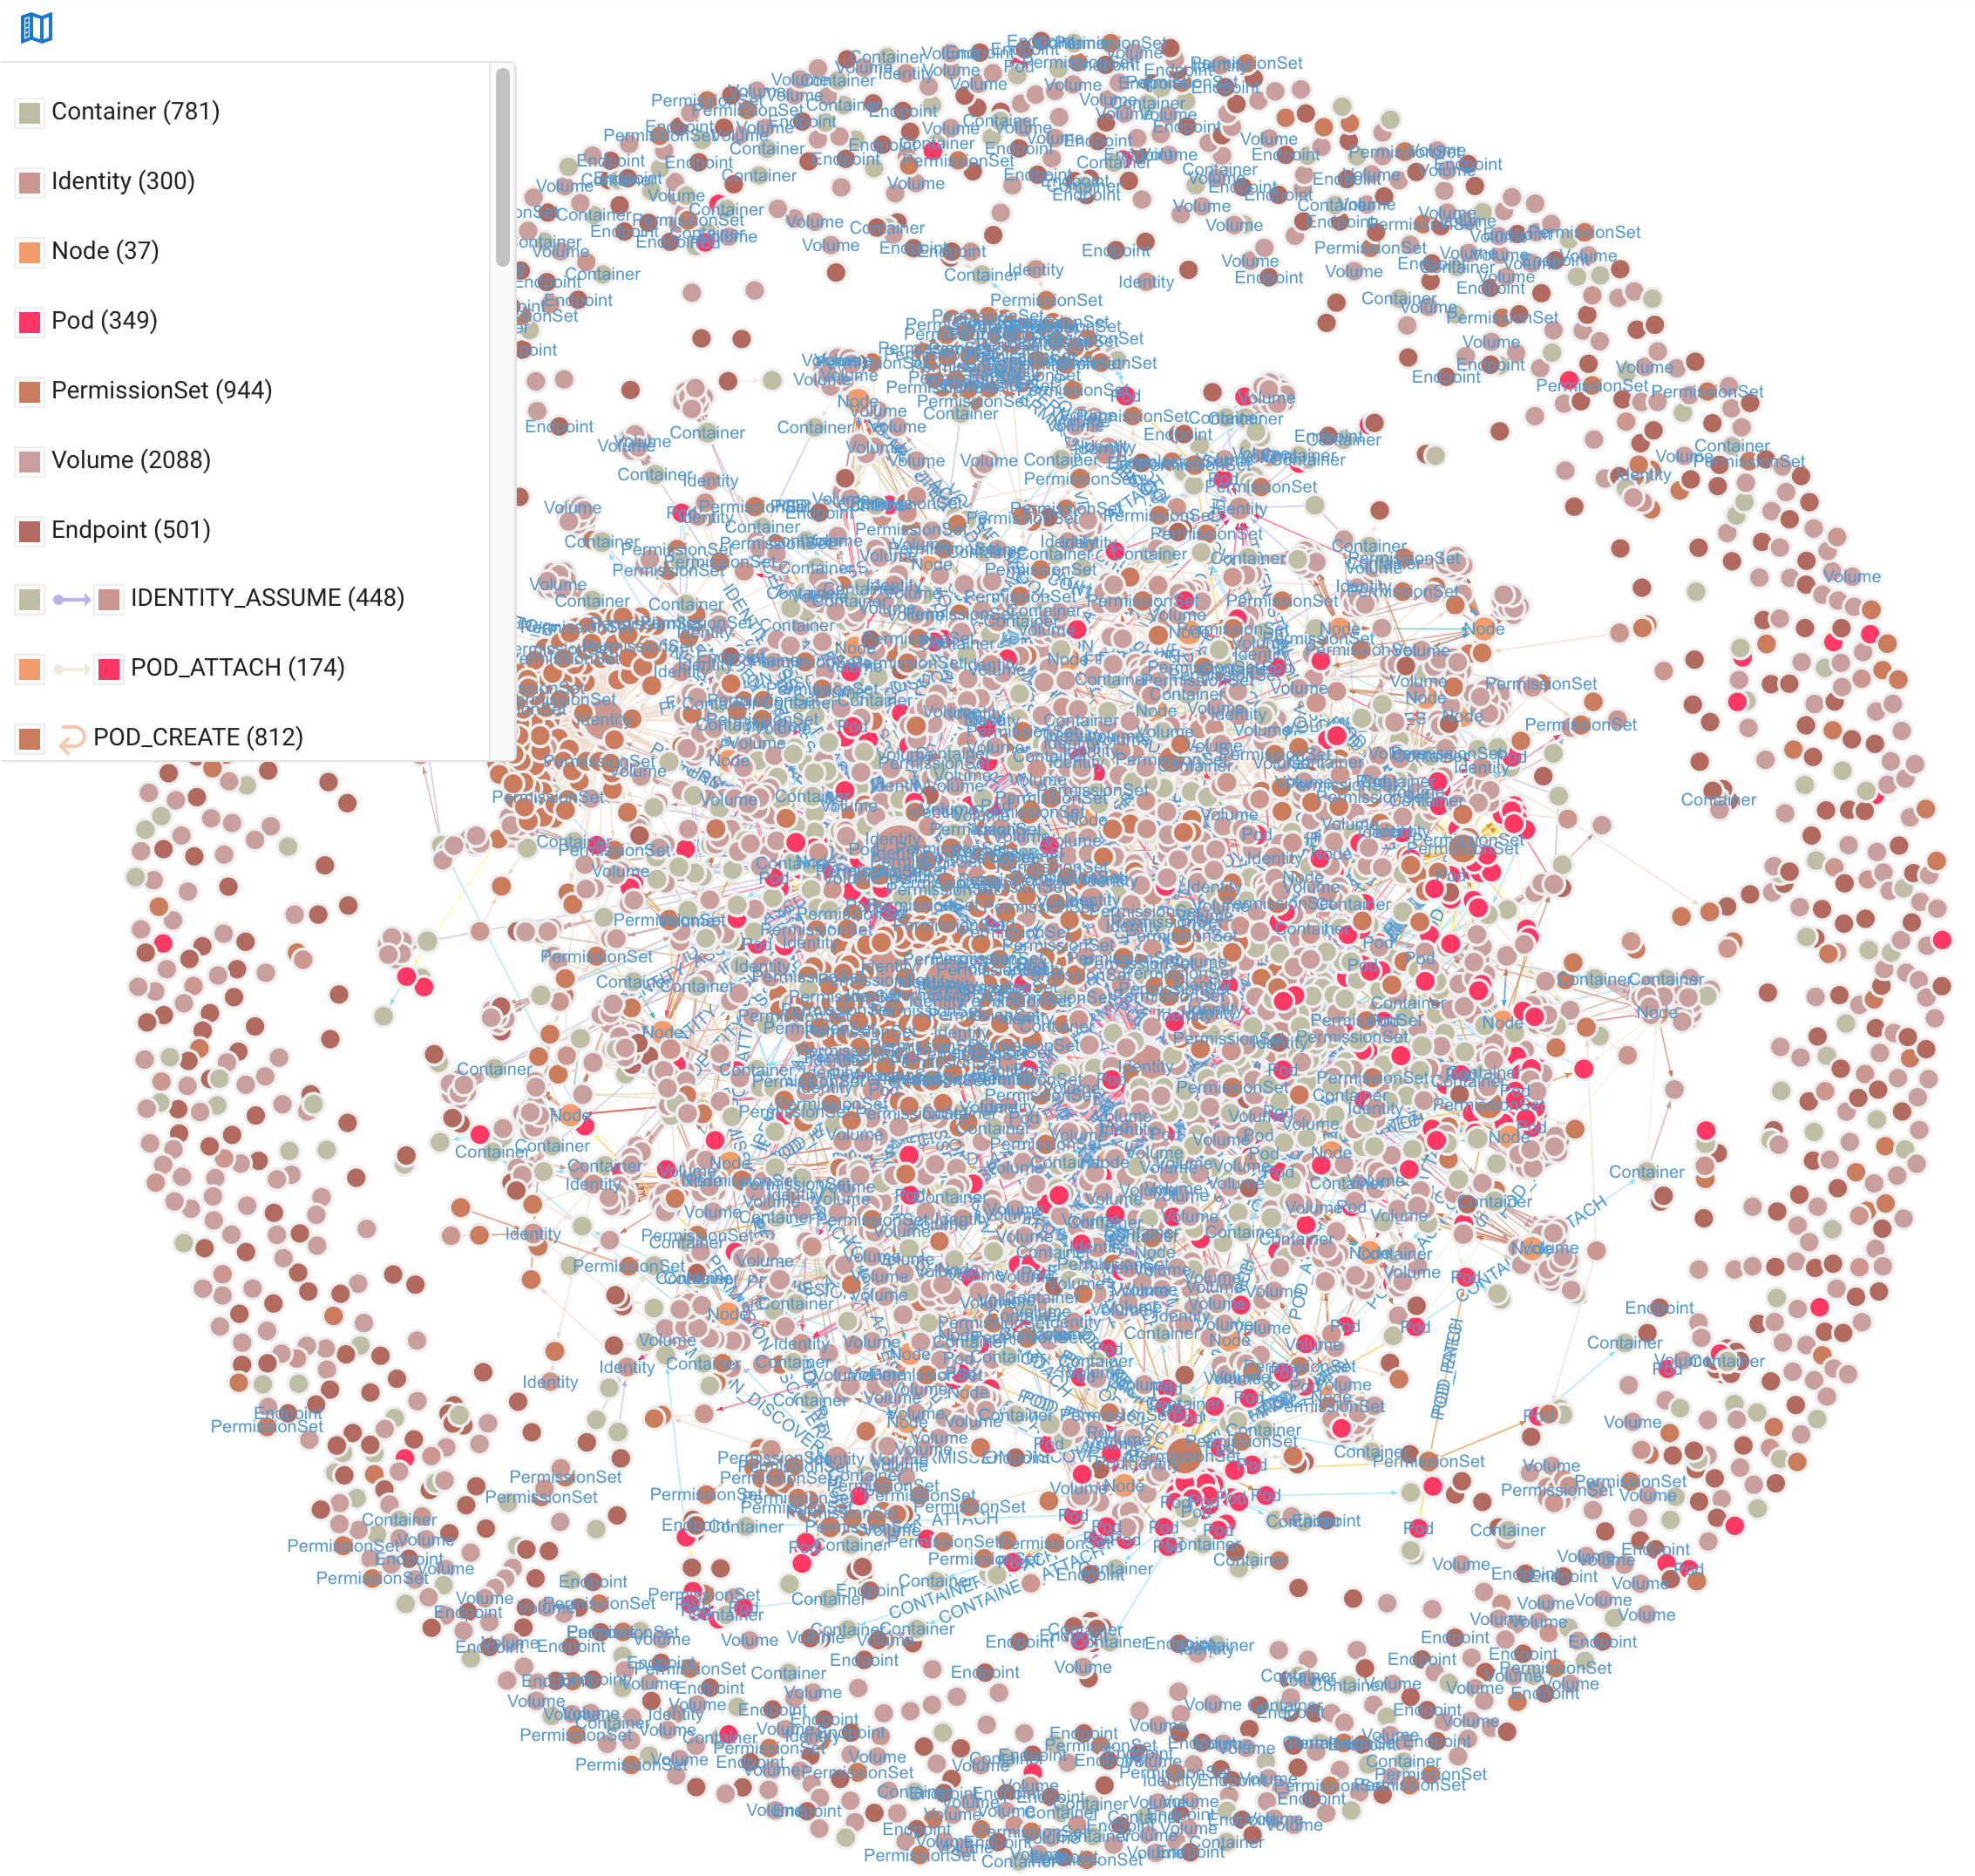
Clearly, the resulting graph represents an extremely high number of attack paths and is too complex to be useful to a human analyst. But because a single deployment usually spawns several pods, we can reduce the number of critical attack paths by deduplicating our results by container name:
kh.containers().dedup().by("name").criticalPaths().count()
⇒ 771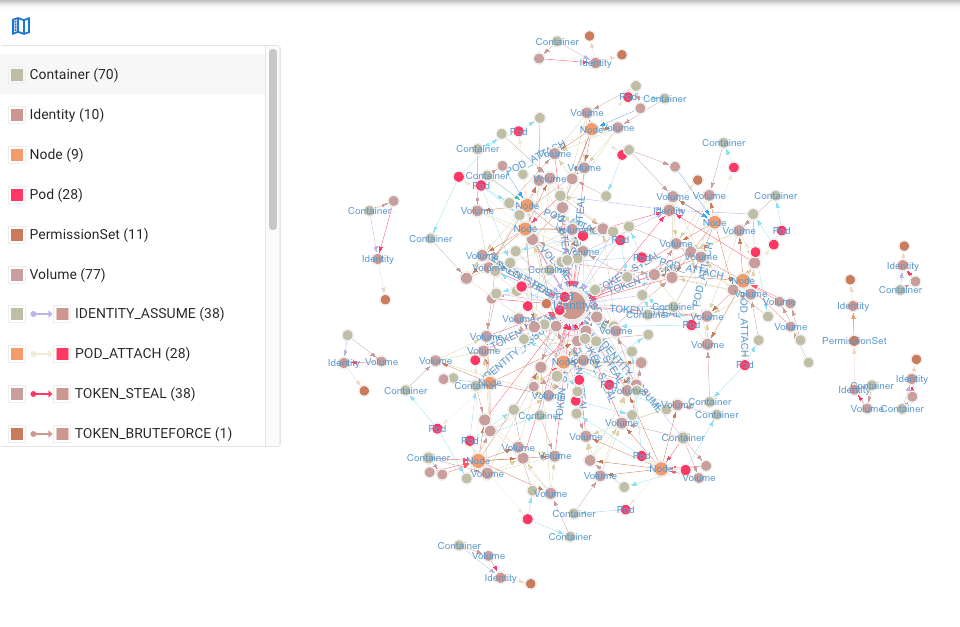
Inside a cluster not all containers have the same exposure. Some containers might need elevated rights—for example, the container where you are running the Cilium agent. But these types of containers are less likely to get compromised, because they usually do not expose any service. (Of course, there are ways to gain access to those containers, such as through supply chain attacks, but we will leave that outside the scope of this use case).
A good starting point is to look at containers with exposed endpoints, which offer the largest attack surface to an attacker because they are the most direct way to gain initial access into the targeted Kubernetes cluster.
To identify these types of attack paths in KubeHound, you can limit your query to paths that start with an endpoint. To make this process easier, KubeHound splits endpoints into three categories:
EndpointExposure.ClusterIP: The container does not externally expose any port, but the endpoint can still be accessed from within the cluster.EndpointExposure.NodeIP: The container exposes an external port that can be accessed depending on firewall rules.EndpointExposure.External: The container exposes an endpoint outside the cluster. This type of endpoint can also be accessed with kh.services().
kh.endpoints(EndpointExposure.ClusterIP).criticalPaths().count()
⇒ 24852

kh.endpoints(EndpointExposure.NodeIP).criticalPaths().count()
⇒ 24792

kh.endpoints(EndpointExposure.External).criticalPaths().count()
// or
kh.services().criticalPaths().count()
⇒ 20
Starting with external endpoints results in a much smaller, more digestible graph that is easier to analyze:
You can also use KubeHound to programmatically extract information related to the attack paths you’ve identified. From a red teamer’s perspective, the most important question to answer is where to start the security testing, So we want to export the service DNS name and the associated port to scan:
kh.endpoints(EndpointExposure.External).criticalPaths().limit(local,1)
.dedup().valueMap("serviceDns","port")
.group().by("serviceDns").by("port")

⇒ {
  "[[metrics-server.clusterx]]" : [ [ 8443 ] ],
  "[[remote-controller.clusterx]]" : [ [ 8000 ], [ 5005 ], [ 443 ] ],
  "[[admin-controller.clusterx]]" : [ [ 8443 ] ],
  "[[admission-controller.clusterx]]" : [ [ 8000 ], [ 443 ], [ 5005 ] ]
}
If you’re a blue teamer, you might be more interested in what role an attacker would gain if they manage to successfully exploit an endpoint.
kh.endpoints(EndpointExposure.External).criticalPaths().tail(local,1)
.dedup().values("role")

⇒ kubeadm:get-nodes
⇒ cluster-admin
With some basic queries, we’ve been able to identify two different attack paths that can lead to the full compromise of the cluster from containers with exposed endpoints—an exercise that might take several days using traditional tools and methods.
Blue team: Assessing the impact of a compromised container
KubeHound provide invaluable insight to help defenders understand the impact of compromise. For instance, let’s say I know that my JobScheduler application has been compromised on the scheduling-jobs-5574f68866-jjbxb pod. What is the risk of this compromise, and what can the attacker do after gaining entry?
As in the previous use case, let's look for any criticalPath().
kh.containers("JobScheduler").has("pod","scheduling-jobs-5574f68866-jjbxb").criticalPaths()
⇒ []
Luckily, no critical attack paths were found—but that does not mean there are no attacks possible or exploitable from the compromised container.
kh.containers("JobScheduler").has("pod","scheduling-jobs-5574f68866-jjbxb").attacks()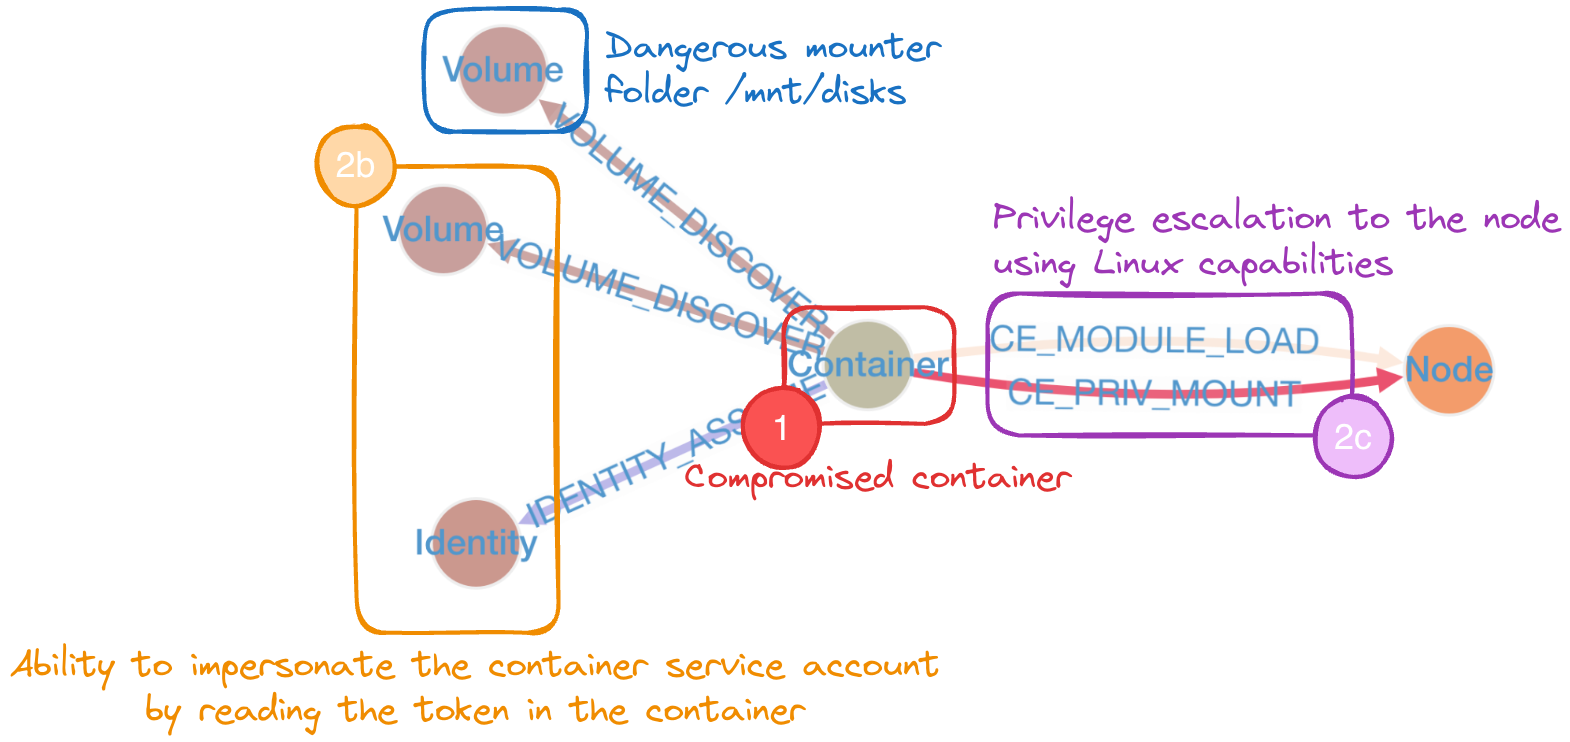
Here, we can see that even though there is no critical attack path, there are still two privilege escalation paths possible from the container to the nodes. So let’s see what lateral movement an attacker can perform and identify which container they can reach. (This type of query is not yet implemented in the KubeHound DSL, so we’ll need to do this through a Gremlin request.)
kh.containers("JobScheduler").has("pod","scheduling-jobs-5574f68866-jjbxb")
.repeat(outE().inV().simplePath()).until(
  hasLabel("Container").or().loops().is(10).or().has("critical", true)
).hasLabel("Container").path()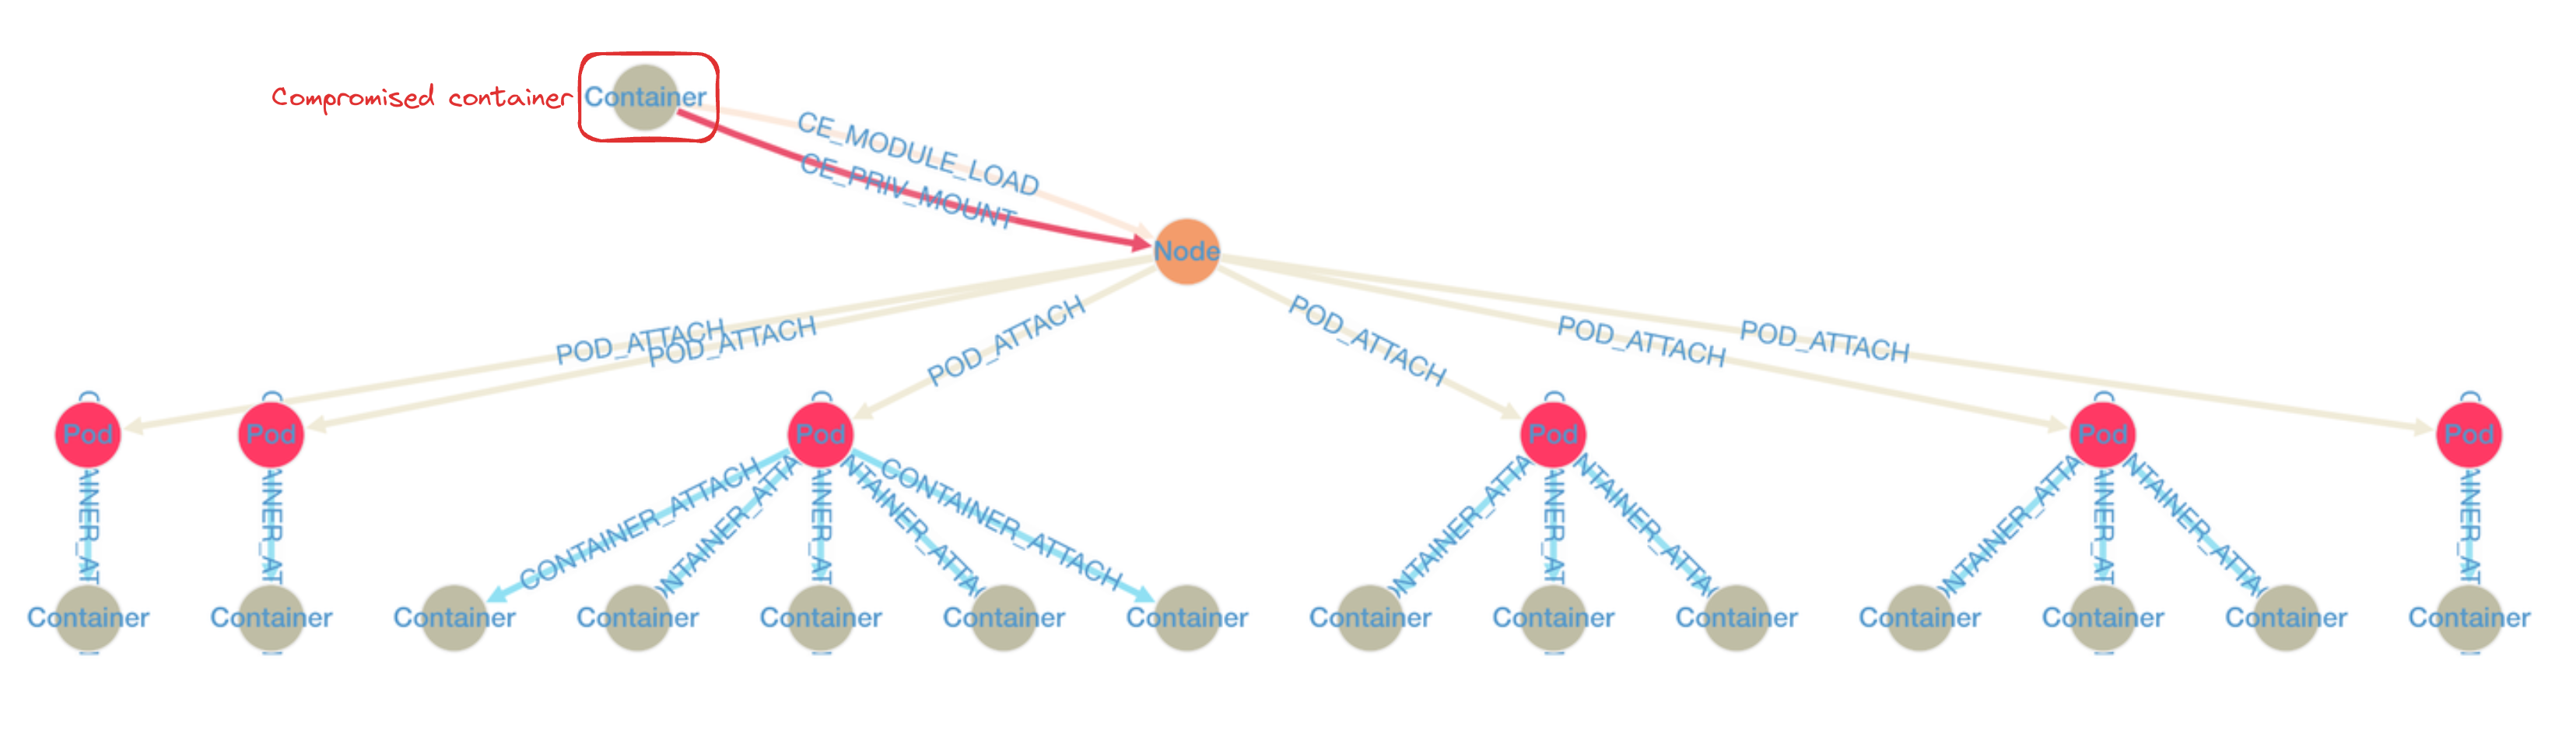
With the resulting graph, we can easily identify which containers are at risk and focus our investigation on those.
kh.containers("JobScheduler").dedup().by("name")
.repeat(outE().inV().simplePath()).until(
  hasLabel("Container").or().loops().is(10).or().has("critical", true)
).hasLabel("Container").path().tail(local,1).values("name").dedup()

⇒ [plugin, agent, zookeeper, node-local-dns, cilium-agent, ...]
This example shows how KubeHound can allow you to scope your investigation from a whole cluster (300 different containers) to 14 specific containers (including the vulnerable one).
Blue team: Remediation
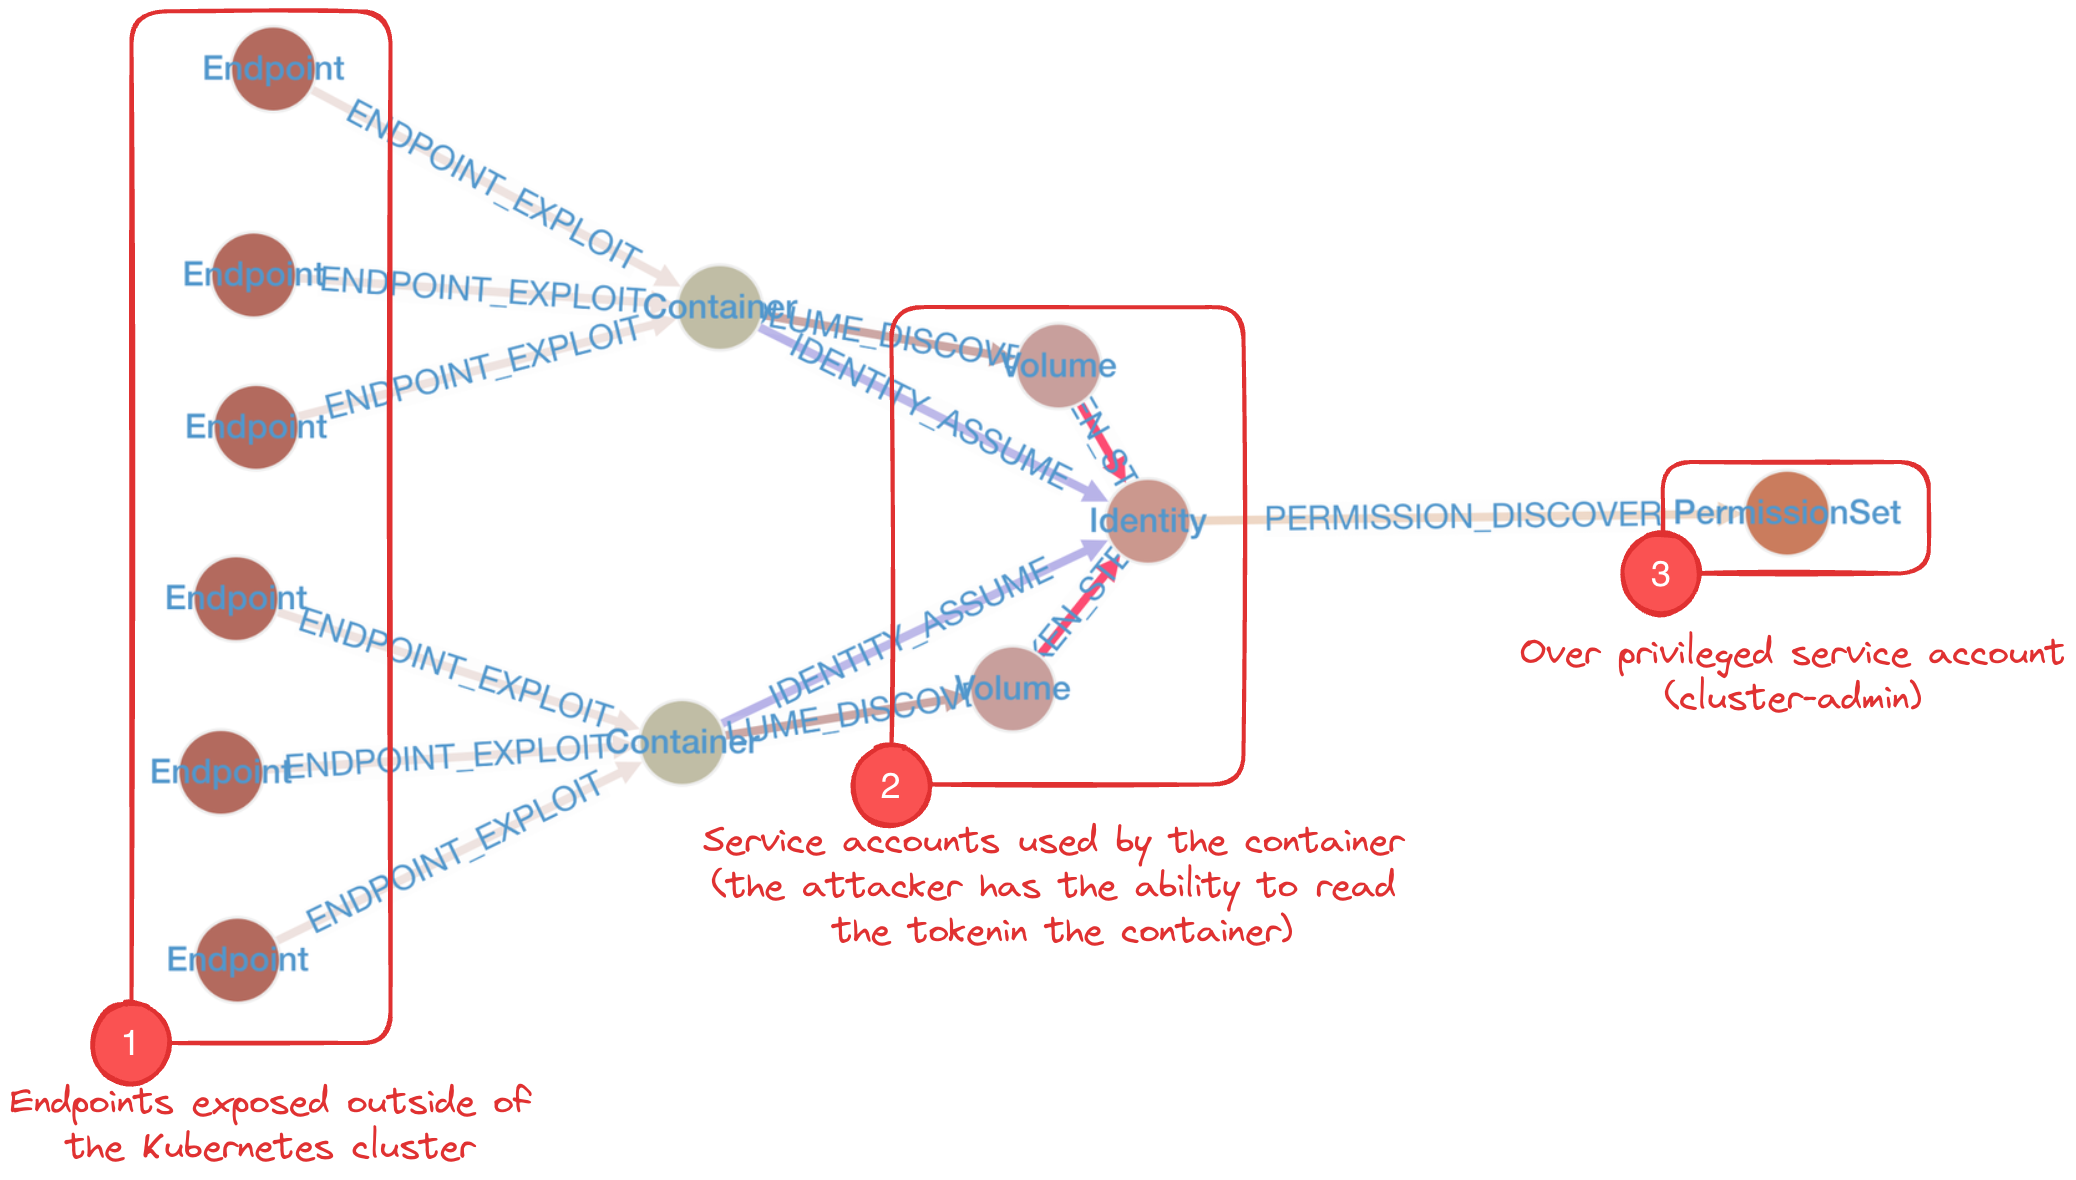
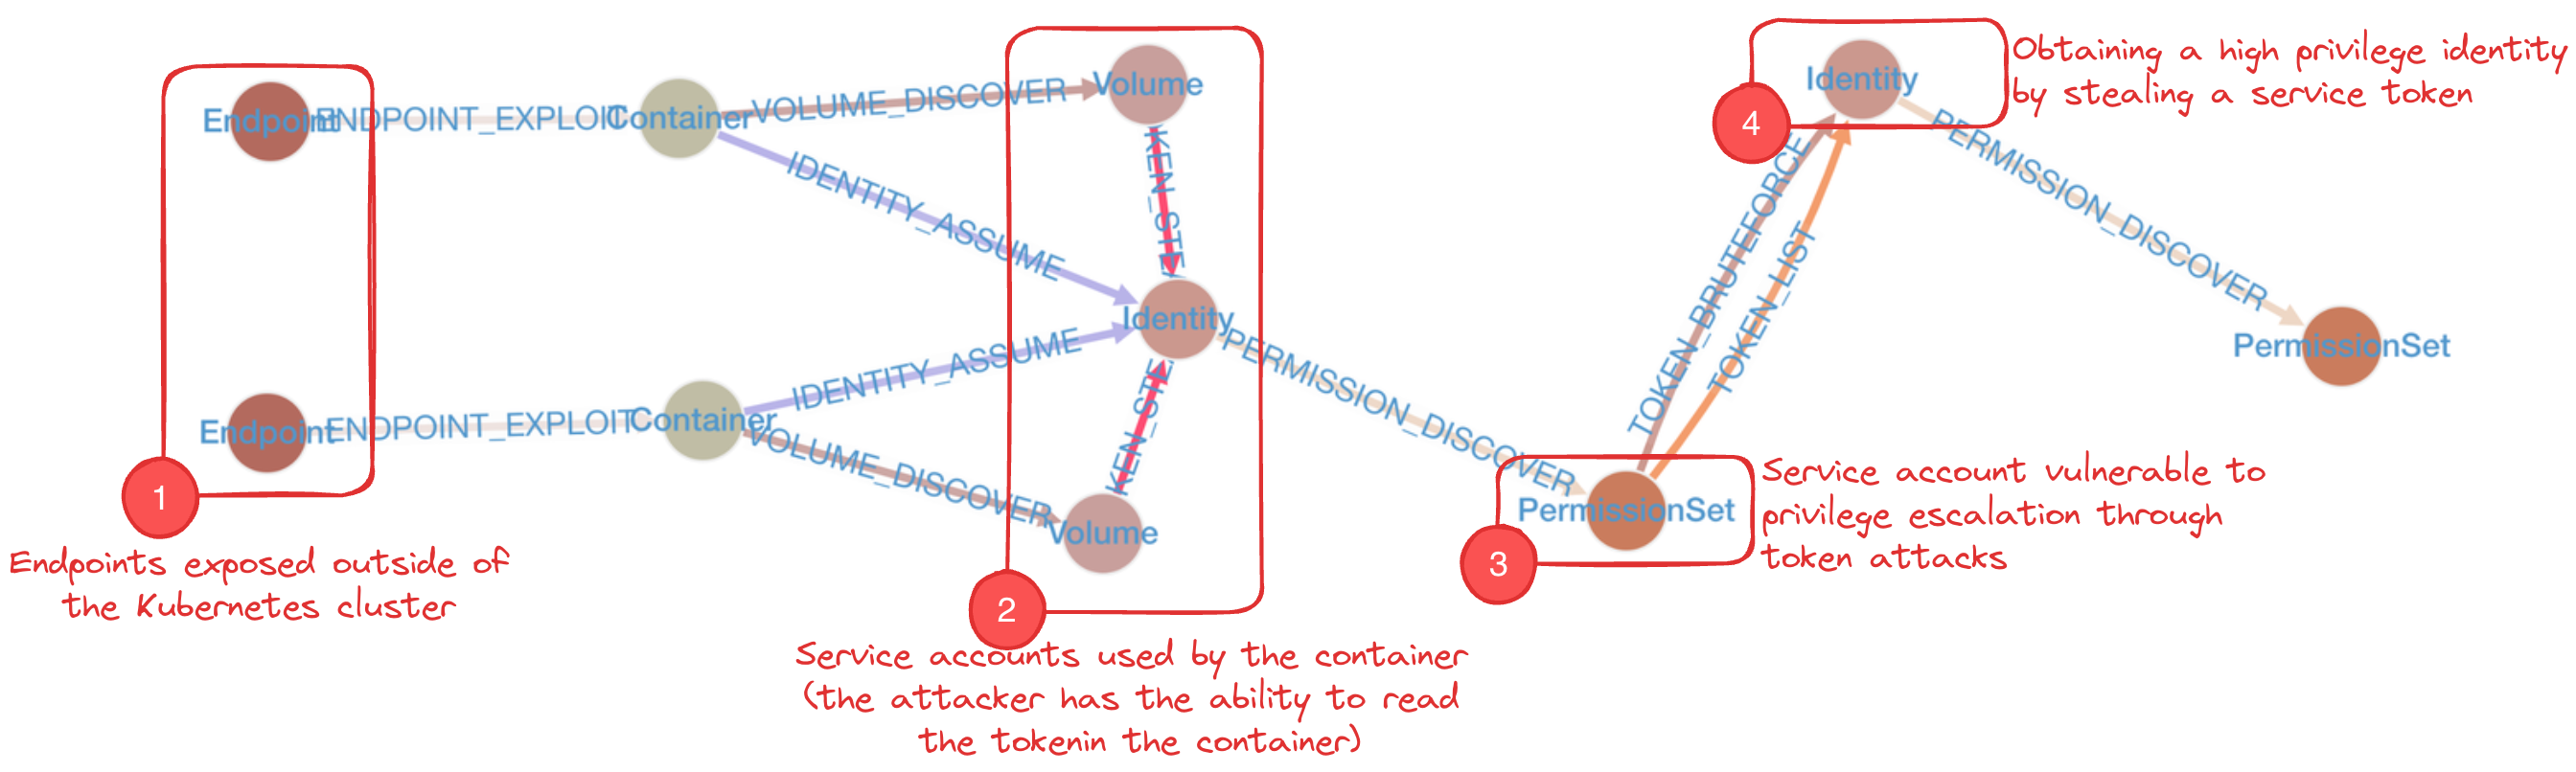
In this example, a threat detection team needs to prioritize security mitigations for a cluster. First, we need to list the attack paths to identify common patterns between them. We can generate this list using the criticalPathsFreq DSL method in KubeHound.
kh.services().criticalPathsFreq()

⇒ {
  "path[Endpoint, ENDPOINT_EXPLOIT, Container, VOLUME_DISCOVER, Volume, TOKEN_BRUTEFORCE, Identity, PERMISSION_DISCOVER, PermissionSet]" : 16,
  "path[Endpoint, ENDPOINT_EXPLOIT, Container, CE_NSENTER, Node, IDENTITY_ASSUME, Identity, PERMISSION_DISCOVER, PermissionSet]" : 1,
  "path[Endpoint, ENDPOINT_EXPLOIT, Container, CE_MODULE_LOAD, Node, IDENTITY_ASSUME, Identity, PERMISSION_DISCOVER, PermissionSet]" : 1,
}
From these results, it appears that the top attack paths use a TOKEN_BRUTEFORCE method, in which an attacker assumes a role allowing get but not list access to secrets. With this access, he can queries (bruteforce) the Kubernetes API to try to retrieve the service account tokens in a namespace or cluster, then uses these credentials to to elevate their privileges. Knowing this, we can implement detections and auto-remediation on secret access to prevent TOKEN_BRUTEFORCE attacks since it is a real noisy attack (requires hundreds of thousands of requests).
But how can we quantify the impact of this remediation on the security of the whole cluster? Is it worth the effort? To measure this impact, we can use KubeHound to evaluate the attack path reduction as a result of remediating the vulnerability that would allow TOKEN_BRUTEFORCE attacks:
// total number of attack paths from service endpoints = B
kh.containers().criticalPaths().count()
⇒ 64964


// number of attack paths from service endpoints excluding the mitigated attack = A
kh.containers().criticalPathsFilter(10, "TOKEN_BRUTEFORCE", "TOKEN_LIST").count()
⇒ 56281
Based on the figures we get back, we can see that preventing TOKEN_BRUTEFORCE attacks removes more than 88 percent of critical attack paths from a public service (16 out of 18) and 14 percent of all critical attack paths in the entire cluster.
Blue team: Metrics and KPIs
In addition to offensive use cases, KubeHound can help teams calculate risk metrics to quantify the security posture of a cluster. It does this by answering some key questions about cluster security.
How many pods are currently deployed with this image?
KubeHound is a graph-oriented tool, but it can also be used as a simple database to list and get quick information about your cluster. For instance, let’s say there is a new disclosure with a fancy logo that announces a critical remote code execution vulnerability that affects a specific version of a public container image.
kh.containers().has("image",TextP.regex(".*/wordpress.*")).hasCriticalPath()
.groupCount().by("image")

⇒ {
  "fakeApp:6.3.1" : 90,
  "fakeApp:6.3.0" : 3,
  "fakeApp:6.2.1" : 6
}
Note: Gremlin DSL supports regex to filter results. But when using a regex filter, the JanusGraph index will not be used so the search can be a lot longer than usual, especially if you use a regex that starts with a wildcard (*) character.
Which images lead to critical assets?
Being able to answer this question can help you identify which images need the most focus in terms of security. If a vulnerability or backdoor is introduced on an image leading to a critical asset, it can lead to full compromise of the cluster.
kh.containers().criticalPaths().limit(local,1).groupCount().by("image")What percentage of external services have an exploitable path to a critical asset?
Understanding this point will provide a good indication of the overall risk your cluster is facing. It will also help you understand your security posture over time. Decreasing this number will lower your cluster’s total security risk.
// number of services with a path to a critical asset = N
kh.services().hasCriticalPath().count()
⇒ 6

// total number of services = D
kh.services().count()
⇒ 846
Based on this result, we can see that 0.7 percent of all containers have endpoints that are exposed outside the cluster and can lead to critical assets.
What is the shortest exploitable path between an internet-facing service and a critical asset?
The more hops—i.e., steps after exploiting a vulnerable entry point—an attacker has to take to access a critical asset, the more difficult and complex the attack is. You can query KubeHound to understand how many hops are involved in breaching a particular cluster. This helps you compare your different clusters and focus your efforts on those with attack paths that involve fewer hops, so you can work to eliminate these paths or make them more difficult to exploit.
kh.services().minHopsToCritical()
⇒ 4
Getting started with KubeHound
KubeHound is divided into:
- The graph database, dockerized and pre-configured for an easy-to-use dockerized backend preconfigured for KubeHound
- A Go binary (Linux / Windows / Mac OS) that collects data from your Kubernetes cluster, computes the attack paths, and stores them in JanusGraph.
This package is available directly via the releases page on our GitHub page. First, download KubeHound:
wget https://github.com/DataDog/KubeHound/releases/latest/download/KubeHound_$(uname -o)_$(uname -m).tar.gz -O kubehound.tar.gz
mkdir kubehound
tar -xf kubehound.tar.gz -C kubehound --strip-components=1
cd kubehound
Then, you can spin up the backend via:
./kubehound.sh backend-upNext, choose a target Kubernetes cluster. You can either:
- Select the targeted cluster via kubectx (needs to be installed separately)
- Use a specific kubeconfig file by exporting the env variable:
export KUBECONFIG=/your/path/to/.kube/config
Then run KubeHound with the default configuration:
./kubehound.sh runFinally, use a Janusgraph GUI like G.V():
- Download and install the application from https://gdotv.com/
- Create a connection to the local janusgraph instance by following the steps here and using
hostname=localhost
See the provided cheat sheet for examples of useful queries for various use cases (either raw Gremlin or KubeHound DSL requests)
What’s under the hood
In this section, we discuss in more detail how KubeHound works under the hood. Before jumping into technical specifics, let’s define some key terms:
- Graph: A data type used to represent complex, non-linear relationships between objects.
- Vertex: The fundamental unit by which graphs are formed. This could also be called a node, but since this term already refers to a Kubernetes resource, we use “vertex” to avoid any confusion.
- Edge: A connection between two vertices.
- Path: A sequence of edges that joins a sequence of vertices.
- Attack: Technically, synonymous with edge. All edges in a KubeHound graph represent a net improvement in an attacker’s position or a lateral movement opportunity. Thus, if any two vertices in the graph are connected, we know an attacker can move between them. As such, “attack” and “edge” are used interchangeably throughout the project.
- Entity: An abstract representation of a Kubernetes component that forms the vertices of our attack graph. These do not necessarily correspond directly to a Kubernetes object; rather, they represent a related construct in an attacker's mental model of the system. Each entity can be tied back to one or more Kubernetes object(s), from which it is derived by the properties of the vertex. For instance, the PermissionSet entity abstracts the Kubernetes Role and ClusterRole objects that have a RoleBinding or ClusterRoleBinding attached.
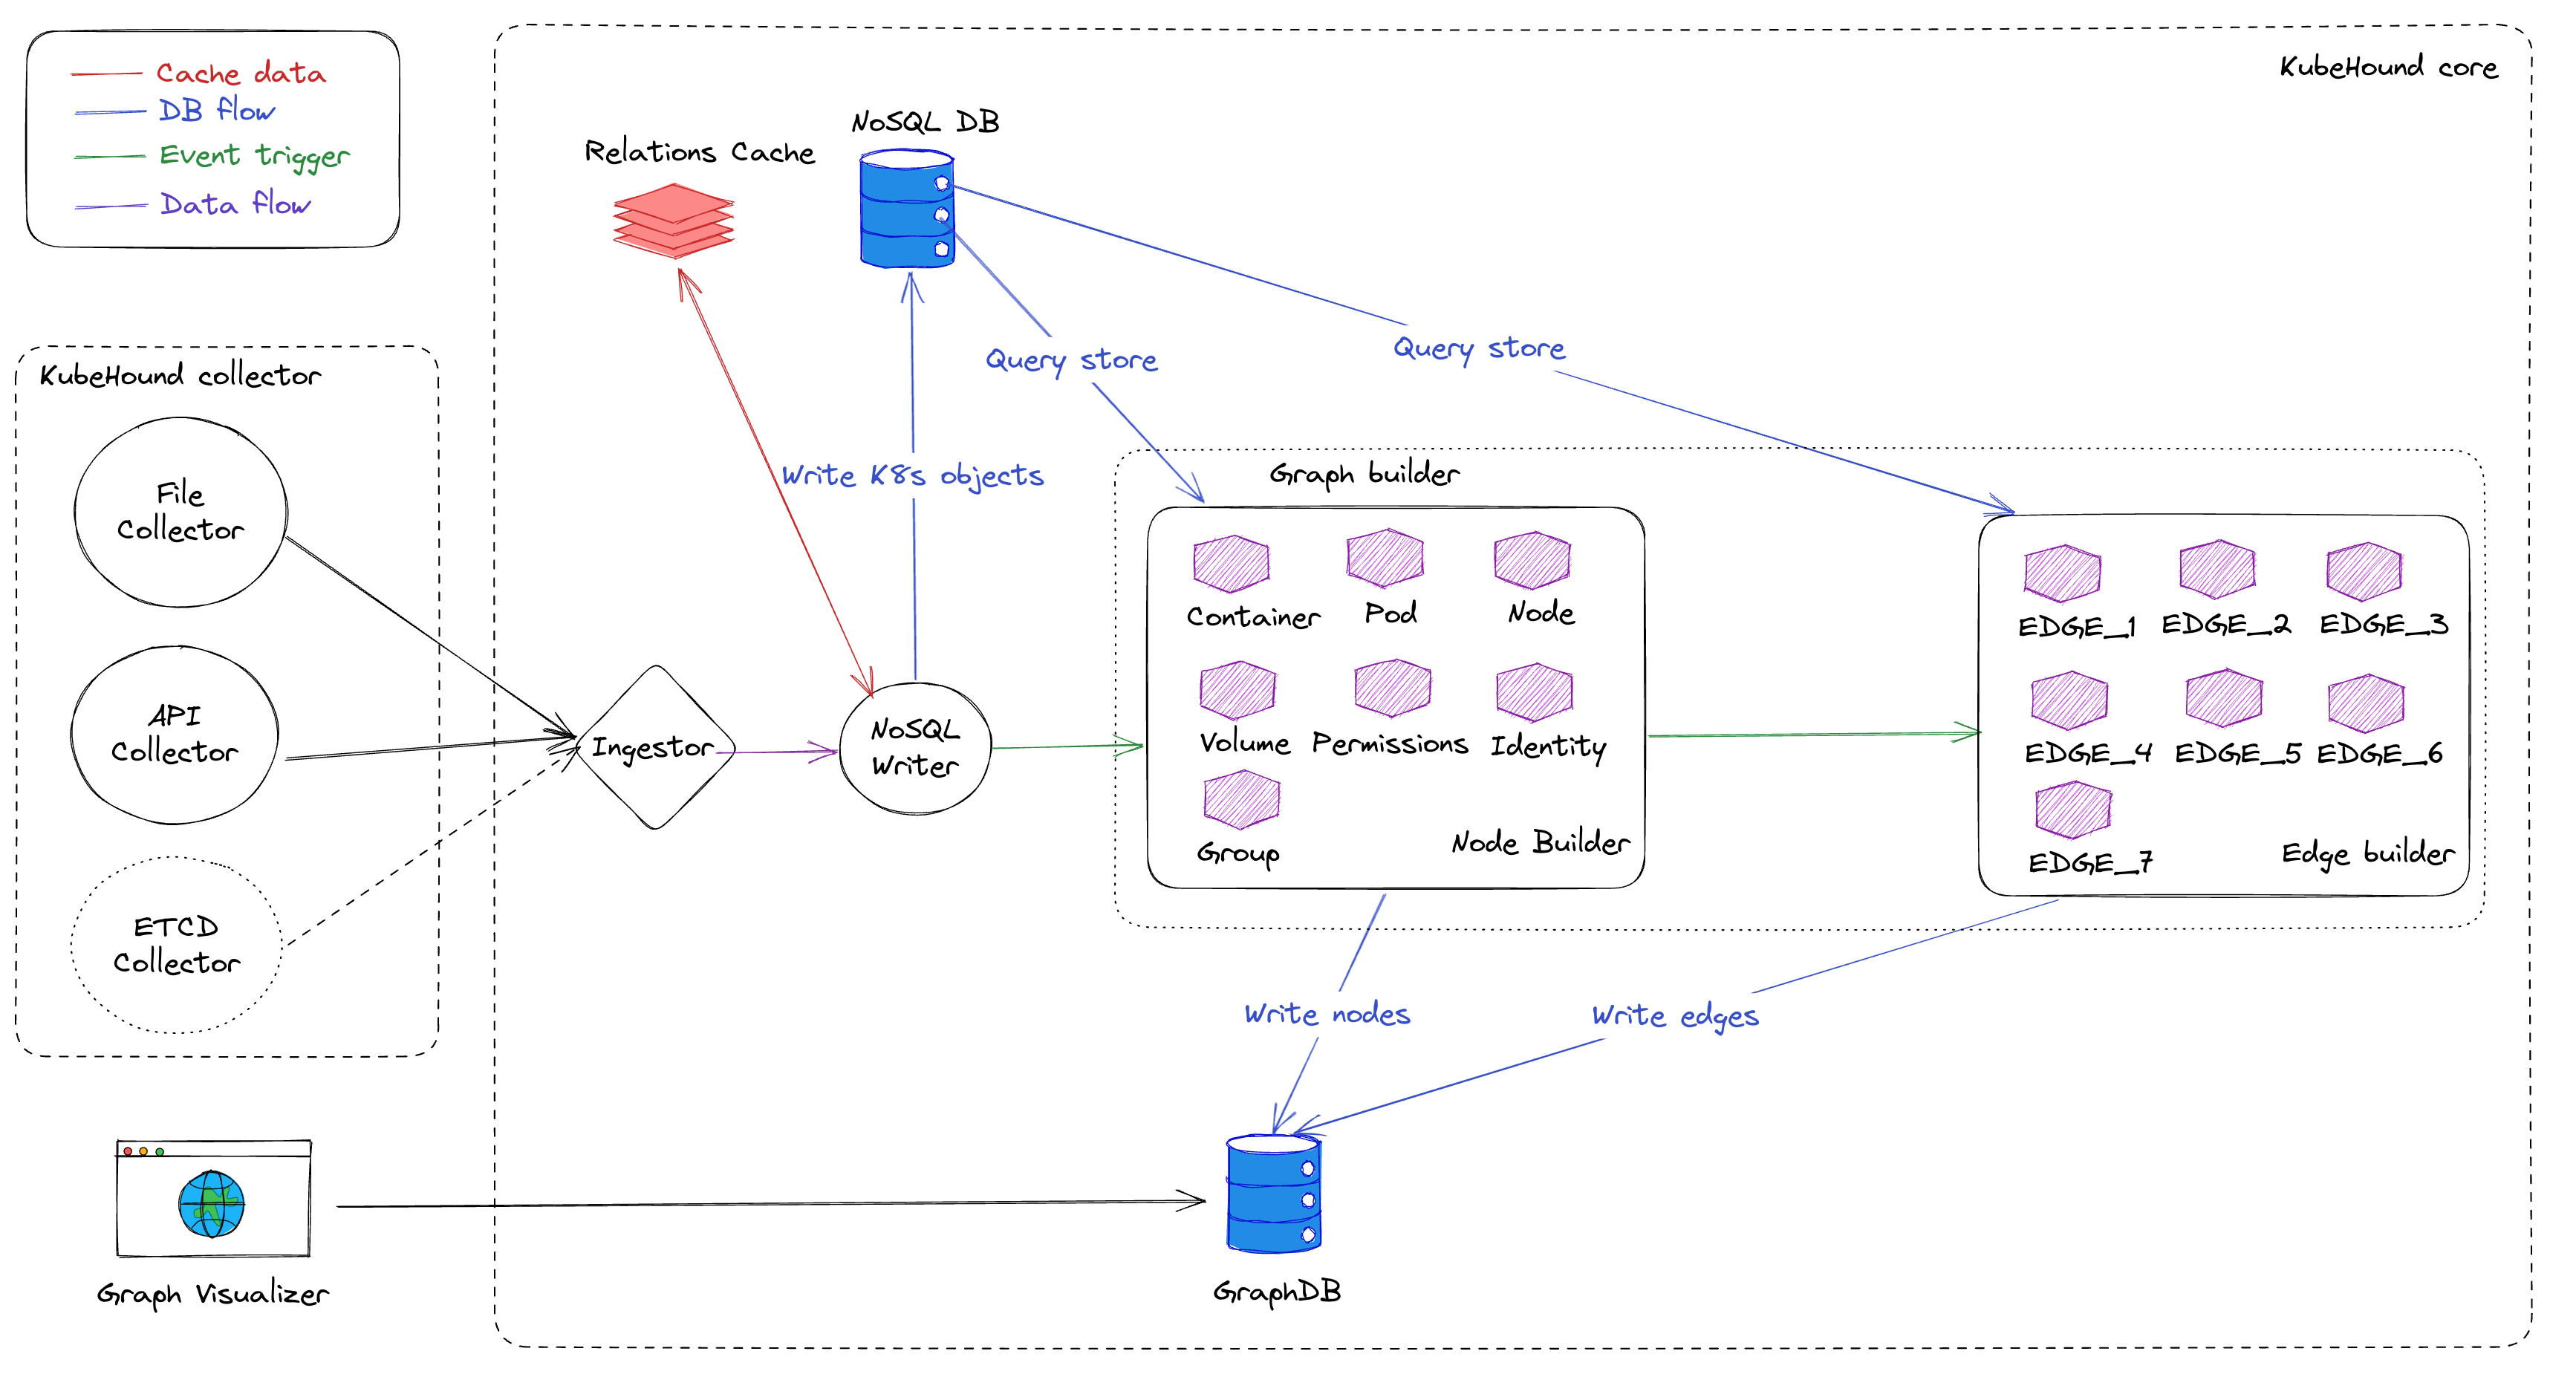
The Go binary component of KubeHound that collects and analyzes data from your clusters is divided into four main parts:
- Collector: Collects all Kubernetes objects from the API server of a target cluster
- Ingestor: Streams Kubernetes objects from the collector into the application’s processing pipeline
- NoSQL writer: Used as temporary storage during the calculation of the attack paths (MongoDB)
- Graph builder: Computes and determines attack paths, then stores them in JanusGraph
All of these components are modular, and the ability to plug in or change components provides some useful functionality. For instance, the collector supports an "offline" mode, allowing you to feed it an offline dump of your cluster's state without direct connection.
Let’s look more closely at how these components work together.
Collecting the data
First, KubeHound ingests all the necessary data from a specific cluster, leveraging the standard Kubernetes API endpoints (Roles, Pods, RoleBindings, Containers, etc.). To avoid crashing the targeted cluster, limitations have been implemented to avoid overwhelming the API. The default values are the same as the official Kubernetes client:
- API rate: 100 requests/sec
- Buffer page size: 10 mb
- Number of elements per page: 500
The collector has been optimized to conduct as many parallel jobs as possible. For instance, it pulls Roles and Containers data at the same time since there is no link between these endpoint types. As an example, KubeHound can collect data from a 100,000-container cluster in less than five minutes.
Ingesting the data
As the collector is running and data is flowing out of it, the KubeHound ingestor reads this data and ingests it all in a database. Currently, we are using MongoDB for convenience, as it is a schemaless database and provides flexibility for future evolution.
During the data ingestion process, KubeHound enriches the data and creates entities to make subsequent stages easier, then stores the whole Kubernetes object. For instance, for the container Kubernetes object, KubeHound adds enhanced fields like hostPID, (a Boolean field to tell if hostPID is activated, to avoid making complex queries into different sources. This step is also when entities are created and merged together as necessary (for instance, parsing RoleBindings or ClusterRoleBindings would lead to a single PermissionSet).
As KubeHound ingests data, it uses a cache system for increased performance.
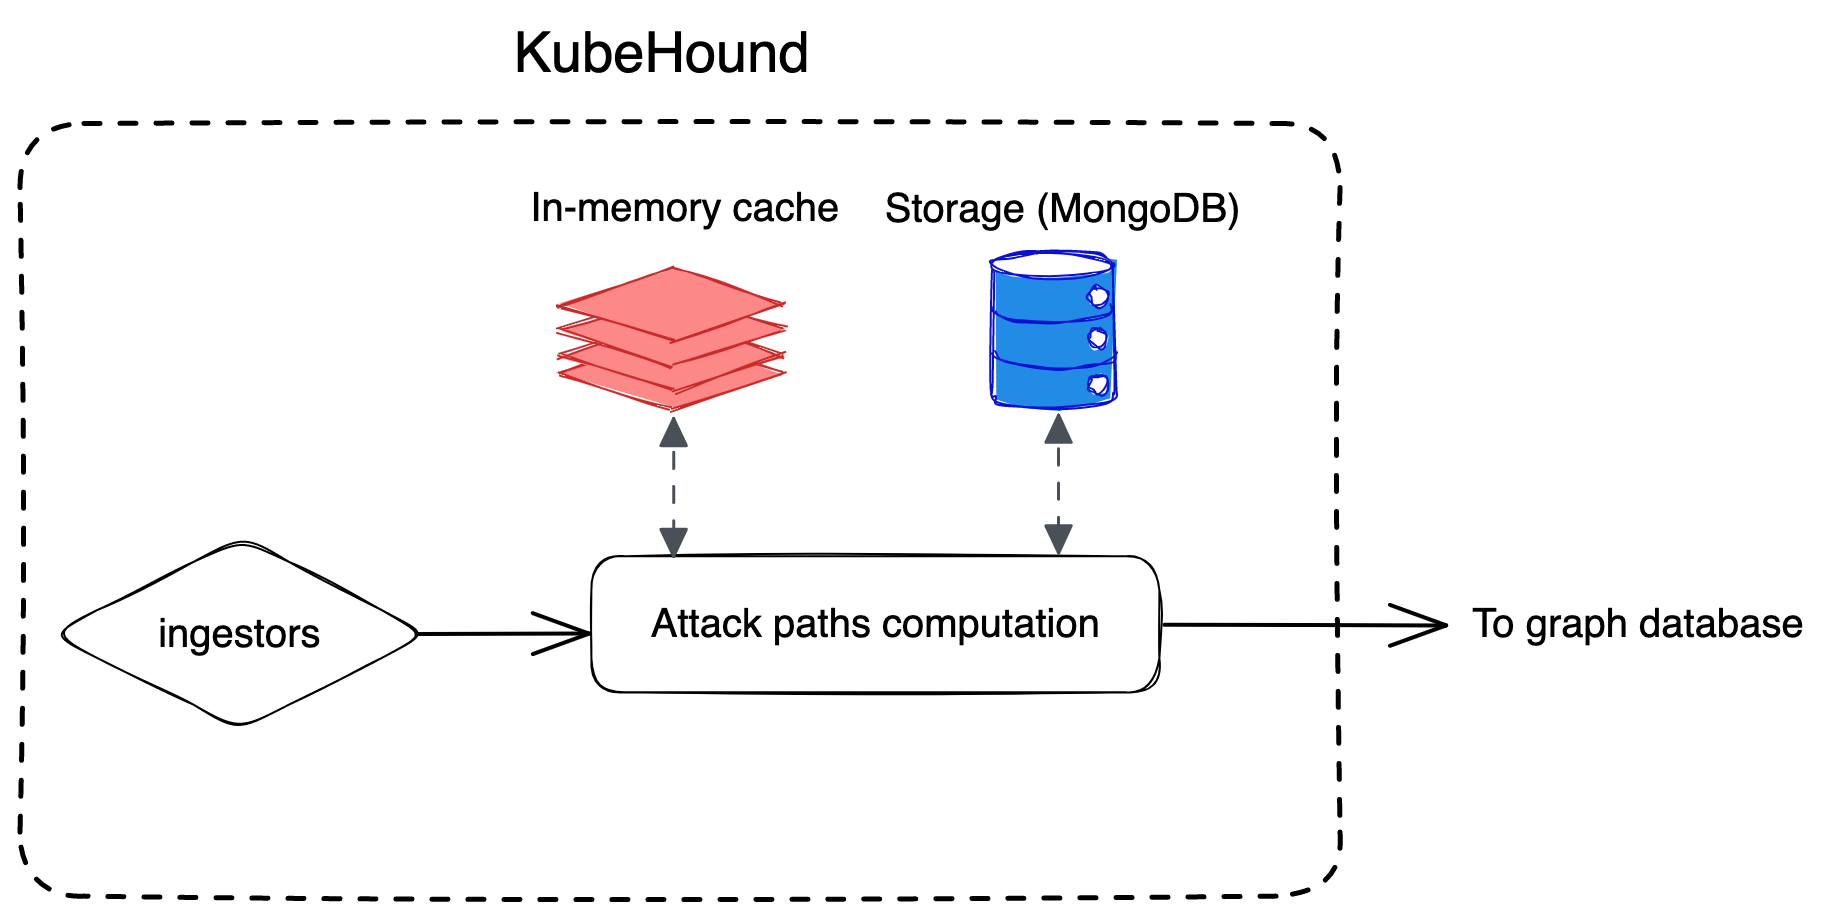
Building the graph
The last step is to build the vertices and the edges. To do this, KubeHound iterates over all the attack paths it identifies and creates the associated assets in the graph database. Because KubeHound uses a NoSQL database as an intermediate step, edges that are not dependent on each other can be calculated in parallel. Using a NoSQL database as an intermediate step also enables KubeHound to extract resources associated with an attack through a single MongoDB query. For instance, this allows you to easily list all the pods on a specific namespace that have the pods/exec privilege.
Once KubeHound has created all the vertices associated with the selected attack—POD_EXEC, in our example—it creates the edges to link the vertices together.
As in the other steps, using only indexed fields in KubeHound’s graph database helps optimize the graph building process. This enables KubeHound to build the graphs for a cluster consisting of 100,000 containers in less than 30 minutes.
What’s next
The first version of KubeHound covers most of the common use cases and should be easy for teams to start using. In the future, we will try to improve the KubeHound DSL to cover more ground, because we know Gremlin can be a little intimidating.
We also hope to add some additional features, including:
- The ability to generate readable reports based on automated queries
- A better integration for offline data collection and ingestion
- A diff checker that will identify changes and progress between two graph snapshots
- The ability to tag any specific assets as critical
This is only the beginning of KubeHound, and we wanted to ensure the community could benefit from the project early on and participate in its development. If you have any ideas or want to collaborate, feel free to open an issue on the repository and we’ll be happy to chat.
As always, we'd love to hear from you. Shoot us a message at securitylabs@datadoghq.com! You can also subscribe to our monthly newsletter to receive our latest research in your inbox, or use our RSS feed.


